
Big data in transportation is – you guessed it – getting even bigger.
But “Big data” is such an expansive topic that it deserves clarification. Google’s definition (almost by definition) should receive instant credibility: “Extremely large data sets that may be analyzed computationally to reveal patterns, trends, and associations, especially relating to human behavior and interactions.”
As a subset of this larger trend, transportation and public policy professionals leverage large volumes of data to analyze and interpret transportation systems. This includes everything from regionwide traffic pattern evaluations to corridor level assessments, utilizing sources ranging from intelligent transportation sensors to anonymized location based services data.
The goal of this activity is simple but challenging: translate more information (more pieces of the puzzle) into better decisions (a prettier picture). The ways in which transportation agencies adapt operations and invest in a mix of maintenance, improvements to existing services, and new capacity affects everyone. No one escapes the consequences, for better or worse.
Getting the data needed to support smart decisions can run into feasibility challenges. That’s where technical experts can weigh in on data storage, schema design, validation, and other terms usually left to specialized experts.
So let’s dive in. This post rolls back the curtain and provides real examples of data in action. The context is key, but the focus will be on particular technical aspects that make these projects possible – specifically, data warehousing in the transportation context involving two projects led by the staff of Cambridge Systematics (CS).
OpsTrac
OpsTrac (Operations Tracking) was CS’s first foray into “data warehousing” (defined below). This R&D effort sought to produce a prototype system for archiving and analyzing historical data from a Traffic Management Center (TMC). TMCs normally operate in real time, aggregating data from numerous sources to provide a timely and dynamic view into current traffic conditions in their respective regions. But at the end of the day, this data, once received, effectively vanishes into thin air, limiting the insights that could be gleaned for improving the management process.
Under this backdrop, the objective of OpsTrac was to first, archive core traffic data, and then, provide tools for graphing, mapping, filtering, and computing statistics from that data. Other data, such as weather conditions or incidents (crashes, construction) could be layered on top to provide further insights.
Because of the sheer volume of the archived data and the desire to perform complex analytics, including graphing and mapping, quickly, it was necessary to use a particular data storage approach called data warehousing.
A data warehouse is a type of data management system designed to contain large amounts of (often) historical data and perform rapid queries and analysis to support business intelligence activities. Commonly, a data warehouse is implemented as an online analytical processing (OLAP) database, which typically uses a schema that allows for fast queries that can cut through the data at many different angles. This is in contrast to an online transaction processing (OLTP) database, which is designed with a greater emphasis on data integrity and supporting rapid inserting/updating of multiple related rows (transactions) as well as fast retrieval of a limited set of queries.
(Now for a brief dive into the deep end of the technical pool, for the transportation and programming enthusiasts among us:)
The OpsTrac data warehouse is built on a relational database but with a particular schema called the star schema. In the star schema, there is typically a small number of Fact tables linked to a single level of Dimension tables.
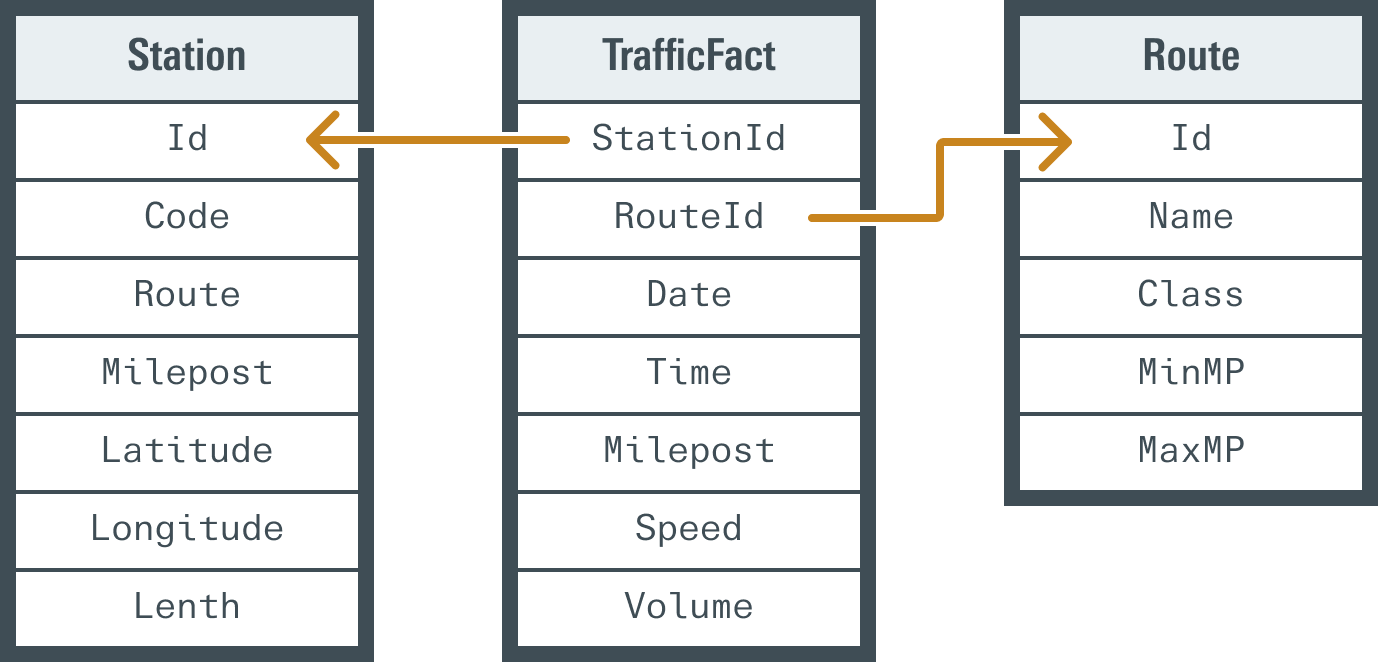
The primary OpsTrac fact table is contextual to traffic operations, storing traffic speed and volume at a given time and location. The two Dimension tables are the Station and Route. Station represents where and how the measurement was taken, such as at a specific detector, or along a specific roadway segment. Route represents a given highway/road/street.
(Now resurfacing:)
Several demos were developed using the prototype system. The project team primarily worked with data from Michigan including statewide data, data along Interstate 95 (I-95), and more detailed data from Detroit. Additional sample data was used from Florida, Indiana, and Kansas City Scout (MoDOT & KDOT).
One of the more compelling OpsTrac demonstrations involved I-95 data. This entailed producing a heatmap of actual traffic, where the X-axis and Y-axis represented distance along I-95 and time of day, respectively; the map colors were computed based on the speed data. Patterns such as rush hours and locations of metropolitan areas jumped off of the screen as immediately obvious. Distinct speed anomalies were also visible, and it was possible to drill into the data and overlay it with other sources such as weather information and construction zones to find correlations with the speed anomalies. The results were truly exciting.
Transportation Information Gateway
OpsTrac proved to be a valuable precursor for a later agency project to develop a Transportation Information Gateway in the New York City metropolitan region. The purpose of the Gateway is to support regional transportation planning processes by providing government agencies and planning organizations, academics, and industry professionals with access to an extensive warehouse of planning-related data and tools to find and make productive use of the data.
While traffic speed data is also a key part of the Gateway, other types of data make use of the warehouse approach as well. These include American Community Survey data, detailed passenger (all modes) flow across bounded regions, demographic data down to the census tract level, location-based modeling data, and transportation project data.
All data sources in the Gateway can be filtered on time, space, and other dimensions, and displayed in maps, charts, and tables. In addition, different data sources can be overlayed on the same map, and specific filter settings can be saved in a “snapshot” for later review or sharing with other users. This makes the tool more than strictly a data warehouse, providing a platform in itself for visualizations to facilitate deeper investigation.
However, creating and configuring the Gateway was not without its challenges. For example, the volume of speed data being stored in the Gateway presents a technical hurdle. There are two sources of speed data that the Gateway currently supports. The first is from the National Performance Management Research Data Set (NPMRDS). The second is from a specific regional Traffic Management Center (TMC). The TMC data covers a smaller area but is finer-grained in both time and space, and so is actually more voluminous. Both data sets are imported on a monthly basis into the Gateway and consist of tens of millions of rows. As such, the data warehouse fact tables would be so large as to make queries very slow without resorting to specialized, expensive hardware.
But there’s a better solution: Partitioning. This technique improves the performance of queries on very large data sets by storing the data in multiple logical partition tables such that queries will generally be restricted to one much smaller table at a time. For both NPMRDS and TMC data, a natural partitioning is at the month level. Most queries are limited to a single day or aggregations across at most a single week, and loading a new month of data consists of creating the table for that month and importing the data directly into the new table.
Conclusion
Data warehousing is a demonstrated and powerful approach for supporting the analysis of large volumes of archived data with greater flexibility and speed. The CS Team experienced this firsthand when they leveraged knowledge gained in developing the OpsTrac protype to inform the successful implementation of the Transportation Information Gateway. But we are not the only game in town. While data warehousing techniques continue to be used in other CS projects, we enjoy learning about new innovations, including in the greater practice of data management and integrations in the transportation industry.
If you would like to share successes, challenges, or spark a conversation together, we would love to hear from you.
To get in touch, you can contact Scott Meeks, a CS Software guru who contributed to both the OpsTrac and Gateway platforms. He can be reached at smeeks@camsys.com when he is not coding for complex projects, reading a Hugo Award Winning novel, or traversing New Zealand on a J.R.R. Tolkien inspired quest.